

Key Takeaways
- Gemini 3.5 Flash remains the top performer on Finance Agent v2, scoring 57.86% accuracy. Claude Fable 5 follows closely at 56.31%, ahead of Claude Opus 4.8 at 53.92%.
- Models are able to handle simple retrieval tasks, but still struggle to perform reliably on harder, multi-step financial work that relies on precise numbers and specific industry convention.
- Even under generous scoring with partial credit, no model clears 58% overall. Under stricter scoring, requiring models to answer perfectly, all models sit below 46% accuracy.
- There is substantial room for improvement: no single model leads on all nine question categories, and the hardest categories, Financial Modeling and Precedents, top out at 23%.
Background
Finance Agent v2 builds on Finance Agent v1.1 with 927 expert-reviewed questions across public, private validation, and held-out test splits. Dataset design, splits, and access are covered in Methodology.
The benchmark tests a model’s ability to perform the work of entry-level financial analysts — answering difficult questions on public company filings.
Automating analyst-grade financial research is valuable because the work is expensive, repetitive, and time-sensitive: analysts often need to move from filings and transcripts to a defensible model or investment memo under deadline. The work is also difficult because the answer depends on finding the right source, applying the right finance convention, and carrying precise intermediate numbers through several steps.
Finance Agent v2 measures how well AI can aid analysts in automating busy work so they can focus on higher-leverage tasks.
Results
The Pareto chart above illustrates how model accuracy trades off against cost and latency. Gemini 3.5 Flash leads in accuracy while also costing less than the top Claude runs. Claude Fable 5 is close behind on accuracy, but is slower and more expensive; Claude Opus 4.8 is third with lower cost than Fable 5.
The mid-tier models sit only a few points below the leaders at a fraction of the cost, suggesting the accuracy premium at the frontier is modest relative to the price gap.
Where Models Stand
The retrieval and summarization categories cluster at the top: Earnings Analysis, General Quantitative, and General Qualitative all clear 70%. Disclosure Analysis and Market Analysis sit in the mid-60s. Adjustments and Comparables drop into the 45-50% band as cross-document reconciliation gets harder. Financial Modeling and Precedents collapse to the low 20s, where multi-step synthesis and chained arithmetic break down.
When measuring models on their ability to perfectly answer questions, there is a consistent 11-13 point drop across the leaderboard compared to allowing partially complete responses.
The strongest models clear roughly 46% of questions cleanly; mid-tier models land in the low 30s; the worst performing models fall into the mid-teens. Models are still unable to execute financial tasks perfectly, often missing core details that real analysts would include.
The tool call analysis reveals how many steps the models take to produce an answer. Interestingly, the top performers also register relatively high numbers of tool calls. This suggests that their comparatively strong performance is partly due to leveraging the tools provided.
The radar graph shows the per-model breakdown of tool calls across the six tools.
Calculator is the dominant tool for most frontier models. Higher-performing models tend to spend more of their tool budget on numerical resolution after finding the relevant source material. Lower-performing models lean harder on web_search and retrieve_information, making more exploratory calls that do not translate into correct answers. Price history sits at 4-11% across the board, matching its narrower role in Market Analysis questions.
Model Output Examples
Q
Did NYSE: CNC have to pay a rebate to policyholders in fiscal year 2025 or fiscal year 2020? If not, was the company closer to owing customers a rebate in 2025 or 2020? What were the medical loss ratios in each year?
### Executive Summary
To address the questions regarding Centene Corporation (NYSE: CNC) for fiscal years 2025 and 2020:
1. **Did NYSE: CNC have to pay a rebate to policyholders in FY 2025 or FY 2020?**
* **Yes, at the regulatory plan/state level:** Centene had to pay (and accrued significant liabilities to pay) premium rebates to policyholders and state partners under minimum medical loss ratio (MLR) and return of premium programs in **both** fiscal year 2025 and fiscal year 2020.
* **No, at the consolidated corporate level:** If evaluated as a single company-wide health plan, Centene did not owe a consolidated rebate because its total consolidated Health Benefits Ratio (HBR) remained above the minimum regulatory floors in both years.
2. **Was the company closer to owing customers a rebate in 2025 or 2020?**
* Under the consolidated corporate interpretation, the company was **much closer to owing customers a rebate in fiscal year 2020** than in fiscal year 2025.
* In 2020, Centene's consolidated HBR was **86.2%** (only 1.2 percentage points above the standard 85% large group/Medicaid threshold and 6.2 percentage points above the 80% individual/small group threshold). In 2025, Centene's consolidated HBR rose to **91.9%** (representing a high medical cost environment far above both the 85% and 80% thresholds).
3. **What were the medical loss ratios in each year?**
* Centene reports its medical loss ratio metric as the **Health Benefits Ratio (HBR)** (medical costs as a percentage of premium revenues, excluding separately billed premium taxes).
* **FY 2020 Consolidated HBR:** **86.2%** (exactly **86.22%** calculated).
* **FY 2025 Consolidated HBR:** **91.9%** (exactly **91.92%** calculated).
---
### 1. Analysis of Rebates Paid and Owed (FY 2025 vs. FY 2020)
Health insurance medical loss ratio rebates are calculated on a state-by-state, plan-by-plan basis, rather than on a single consolidated corporate basis. Therefore, even when a company’s overall corporate medical loss ratio is high, specific local plans can fall below regulatory thresholds and trigger rebate payments.
#### **Fiscal Year 2025 Rebates:**
Centene carried active and substantial rebate liabilities throughout 2025 and distributed actual cash rebates to policyholders.
* **Balance Sheet Payables:** On its Consolidated Balance Sheets as of December 31, 2025, Centene carried **$1,592 million** in **Return of premium payable** (current liability) and **$294 million** in ACA **Minimum medical loss ratio payable** (down from $2,008 million and $688 million, respectively, at year-end 2024).
* **Revenue Reductions:** In Note 8 (*Medical Claims Liability*), Centene disclosed that minimum MLR and other return of premium programs reduced prior-year premium revenues by **$93 million** during 2025.
* **Direct Customer Rebates:** Due to lower medical cost trends in Commercial Marketplace plans in preceding years (e.g., Commercial HBR was 77.27% in 2024 and 79.76% in 2023), Centene’s subsidiary **Ambetter from Home State Health** had to distribute **$87.5 million** in ACA MLR cash rebates directly to individual policyholders in Missouri in September 2025.
#### **Fiscal Year 2020 Rebates:**
Similarly, Centene operated under substantial premium return obligations in 2020 during the COVID-19 pandemic when deferred medical care reduced clinical utilization.
* **Balance Sheet Payables:** As of December 31, 2020, Centene recorded **$1,458 million** in **Return of premium payable** and **$238 million** in ACA **Minimum medical loss ratio payable** (down from $824 million and $367 million, respectively, at year-end 2019).
* **Revenue Reductions:** During 2020, Centene recorded **$86 million** as a reduction to premium revenues due to minimum HBR and other return of premium programs related to prior years' development.
---
### 2. Proximity to Triggering Rebates (2020 vs. 2025)
Under regulatory guidelines (such as the ACA and state Medicaid contracts), a **lower** medical loss ratio / Health Benefits Ratio (HBR) brings an insurer closer to (or below) the statutory floors where rebates must be returned to consumers.
* **In 2020:** The consolidated HBR of **86.2%** was only **1.2% above** the standard 85% large group and Medicaid floor. This made the company highly susceptible to owing rebates, as any further reduction in medical utilization would have dropped them below the regulatory floor on a broader scale.
* **In 2025:** The consolidated HBR of **91.9%** was driven by high medical utilization, higher behavioral and home healthcare costs, and changes in risk adjustment models. This left them **6.9% above** the 85% floor and **11.9% above** the 80% individual/small group floor, placing them far from owing rebates on a consolidated scale.
Therefore, the company was **much closer to owing customer rebates in 2020**.
---
### 3. Medical Loss Ratios (HBR) in Each Year
Centene’s medical loss ratio is reported in its SEC filings as the **Health Benefits Ratio (HBR)**. HBR represents medical costs as a percentage of premium revenues, excluding premium taxes that are separately billed.
#### **A. Fiscal Year 2020 Consolidated HBR:**
* **Reported Consolidated HBR:** **86.2%**
* **Exact Mathematical HBR:** **86.22%**
* *Formula:* Consolidated Medical Costs $\div$ Premium Revenues (excluding premium tax and health insurer fees)
* *Calculation:*
$$\text{HBR} = \frac{\$86,264 \text{ million}}{\$100,055 \text{ million}} = 86.2166\%$$
#### **B. Fiscal Year 2025 Consolidated HBR:**
* **Reported Consolidated HBR:** **91.9%**
* **Exact Mathematical HBR:** **91.92%**
* *Formula:* Consolidated Medical Costs $\div$ Premium Revenues (excluding premium taxes)
* *Calculation:*
$$\text{HBR} = \frac{\$157,702 \text{ million}}{\$171,556 \text{ million}} = 91.9245\%$$
#### **C. 2025 Segment-Level HBR Breakdowns (Calculated from Note 19 Segment Data):**
While consolidated HBR was high in 2025, the segmentation illustrates that the Commercial business (where individual policyholder rebates reside) operated at a lower ratio compared to other lines of business:
* **Medicaid HBR:** **93.7%** (calculated as $\$84,450 \text{M (Medical Costs)} \div \$90,137 \text{M (Premium)}$)
* **Medicare HBR:** **92.0%** (calculated as $\$34,227 \text{M (Medical Costs)} \div \$37,210 \text{M (Premium)}$)
* **Commercial HBR:** **87.9%** (calculated as $\$36,902 \text{M (Medical Costs)} \div \$42,001 \text{M (Premium)}$)
* **Other HBR:** **96.2%** (calculated as $\$2,123 \text{M (Medical Costs)} \div \$2,208 \text{M (Premium)}$)
---
### Sources
```json
{
"sources": [
{
"url": "https://www.sec.gov/Archives/edgar/data/1071739/000107173926000049/cnc-20251231.htm",
"name": "Centene Corporation Form 10-K for the Fiscal Year Ended December 31, 2025"
},
{
"url": "https://www.sec.gov/Archives/edgar/data/1071739/000107173921000039/cnc-20201231.htm",
"name": "Centene Corporation Form 10-K for the Fiscal Year Ended December 31, 2020"
},
{
"url": "https://missouriindependent.com/2025/09/22/federal-rules-force-1b-in-customer-rebates-for-missouris-biggest-health-insurer/",
"name": "Missouri Independent: Federal rules force customer rebates for Missouri’s biggest health insurer"
}
]
}
```
60
Missed checks:
• Response states that the company did not owe a rebate in 2025
• Response states that the company did not owe a rebate in 2020
The question above is a General Quantitative Analysis task: deciding whether Centene owed a rebate to policyholders in either fiscal year based on the medical loss ratio threshold, and reporting the underlying MLRs.
Trajectory Comparison
The visualizations below show how a frontier model and a smaller, cheaper model approached the same Financial Modeling question of building a DCF model. Each row is one agent turn; bar width is wall-clock time per turn (model reasoning + tool execution).
Claude Opus 4.7 trajectory (passed most checks):
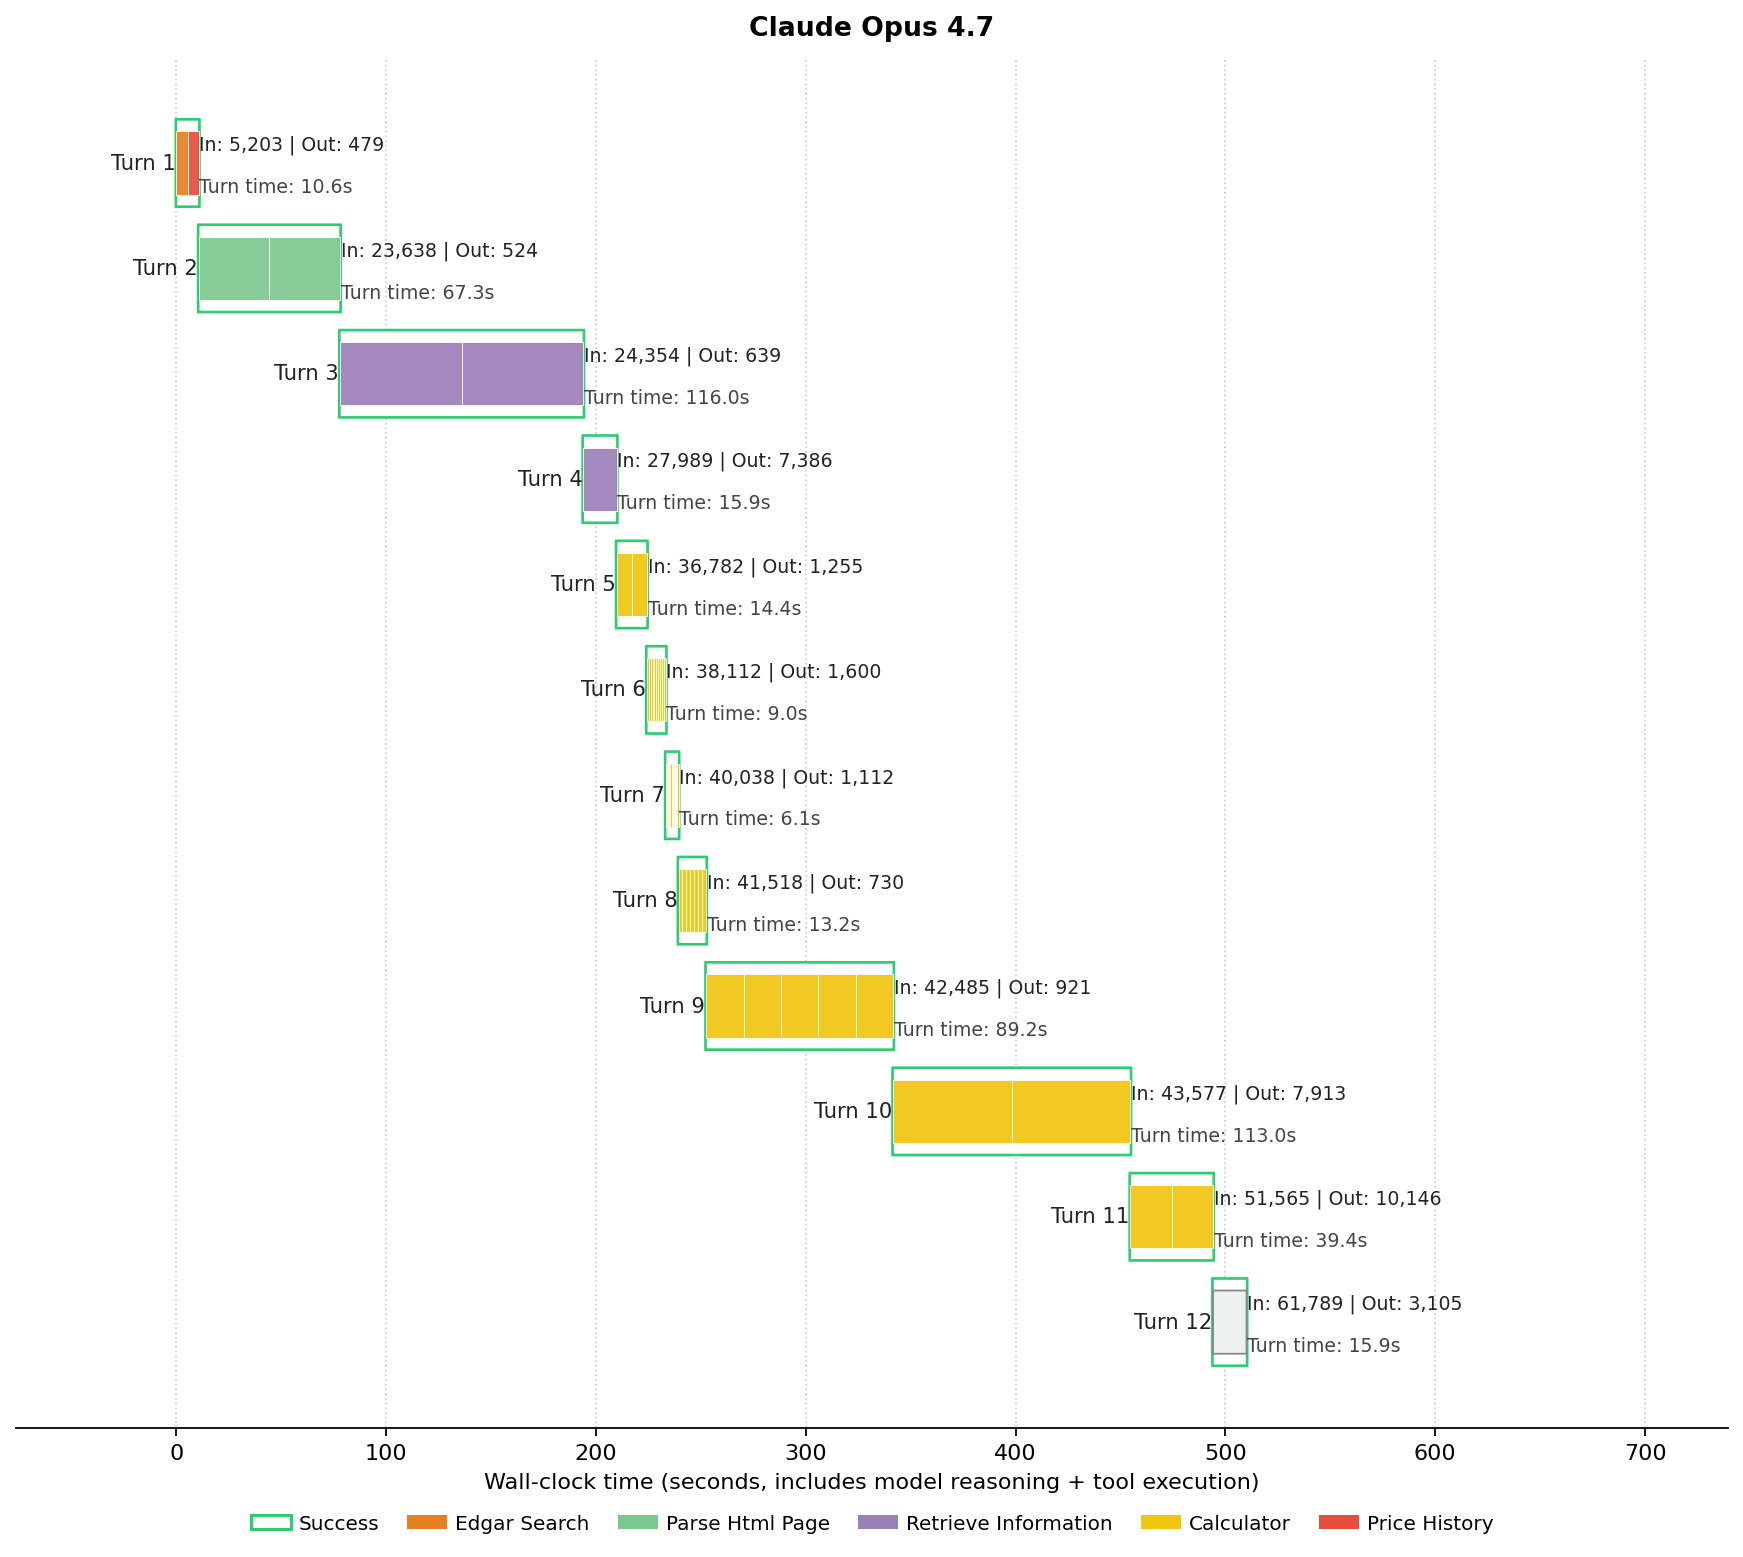
The frontier model worked through the question in 12 turns: pull market data, fetch and parse the two filings, run retrieve_information to extract the inputs needed for the DCF, then step through bursts of parallel calculator calls to compute projections, terminal value, and discounted cash flows before submitting.
GPT 5.4 Nano trajectory (zeroed on most checks):
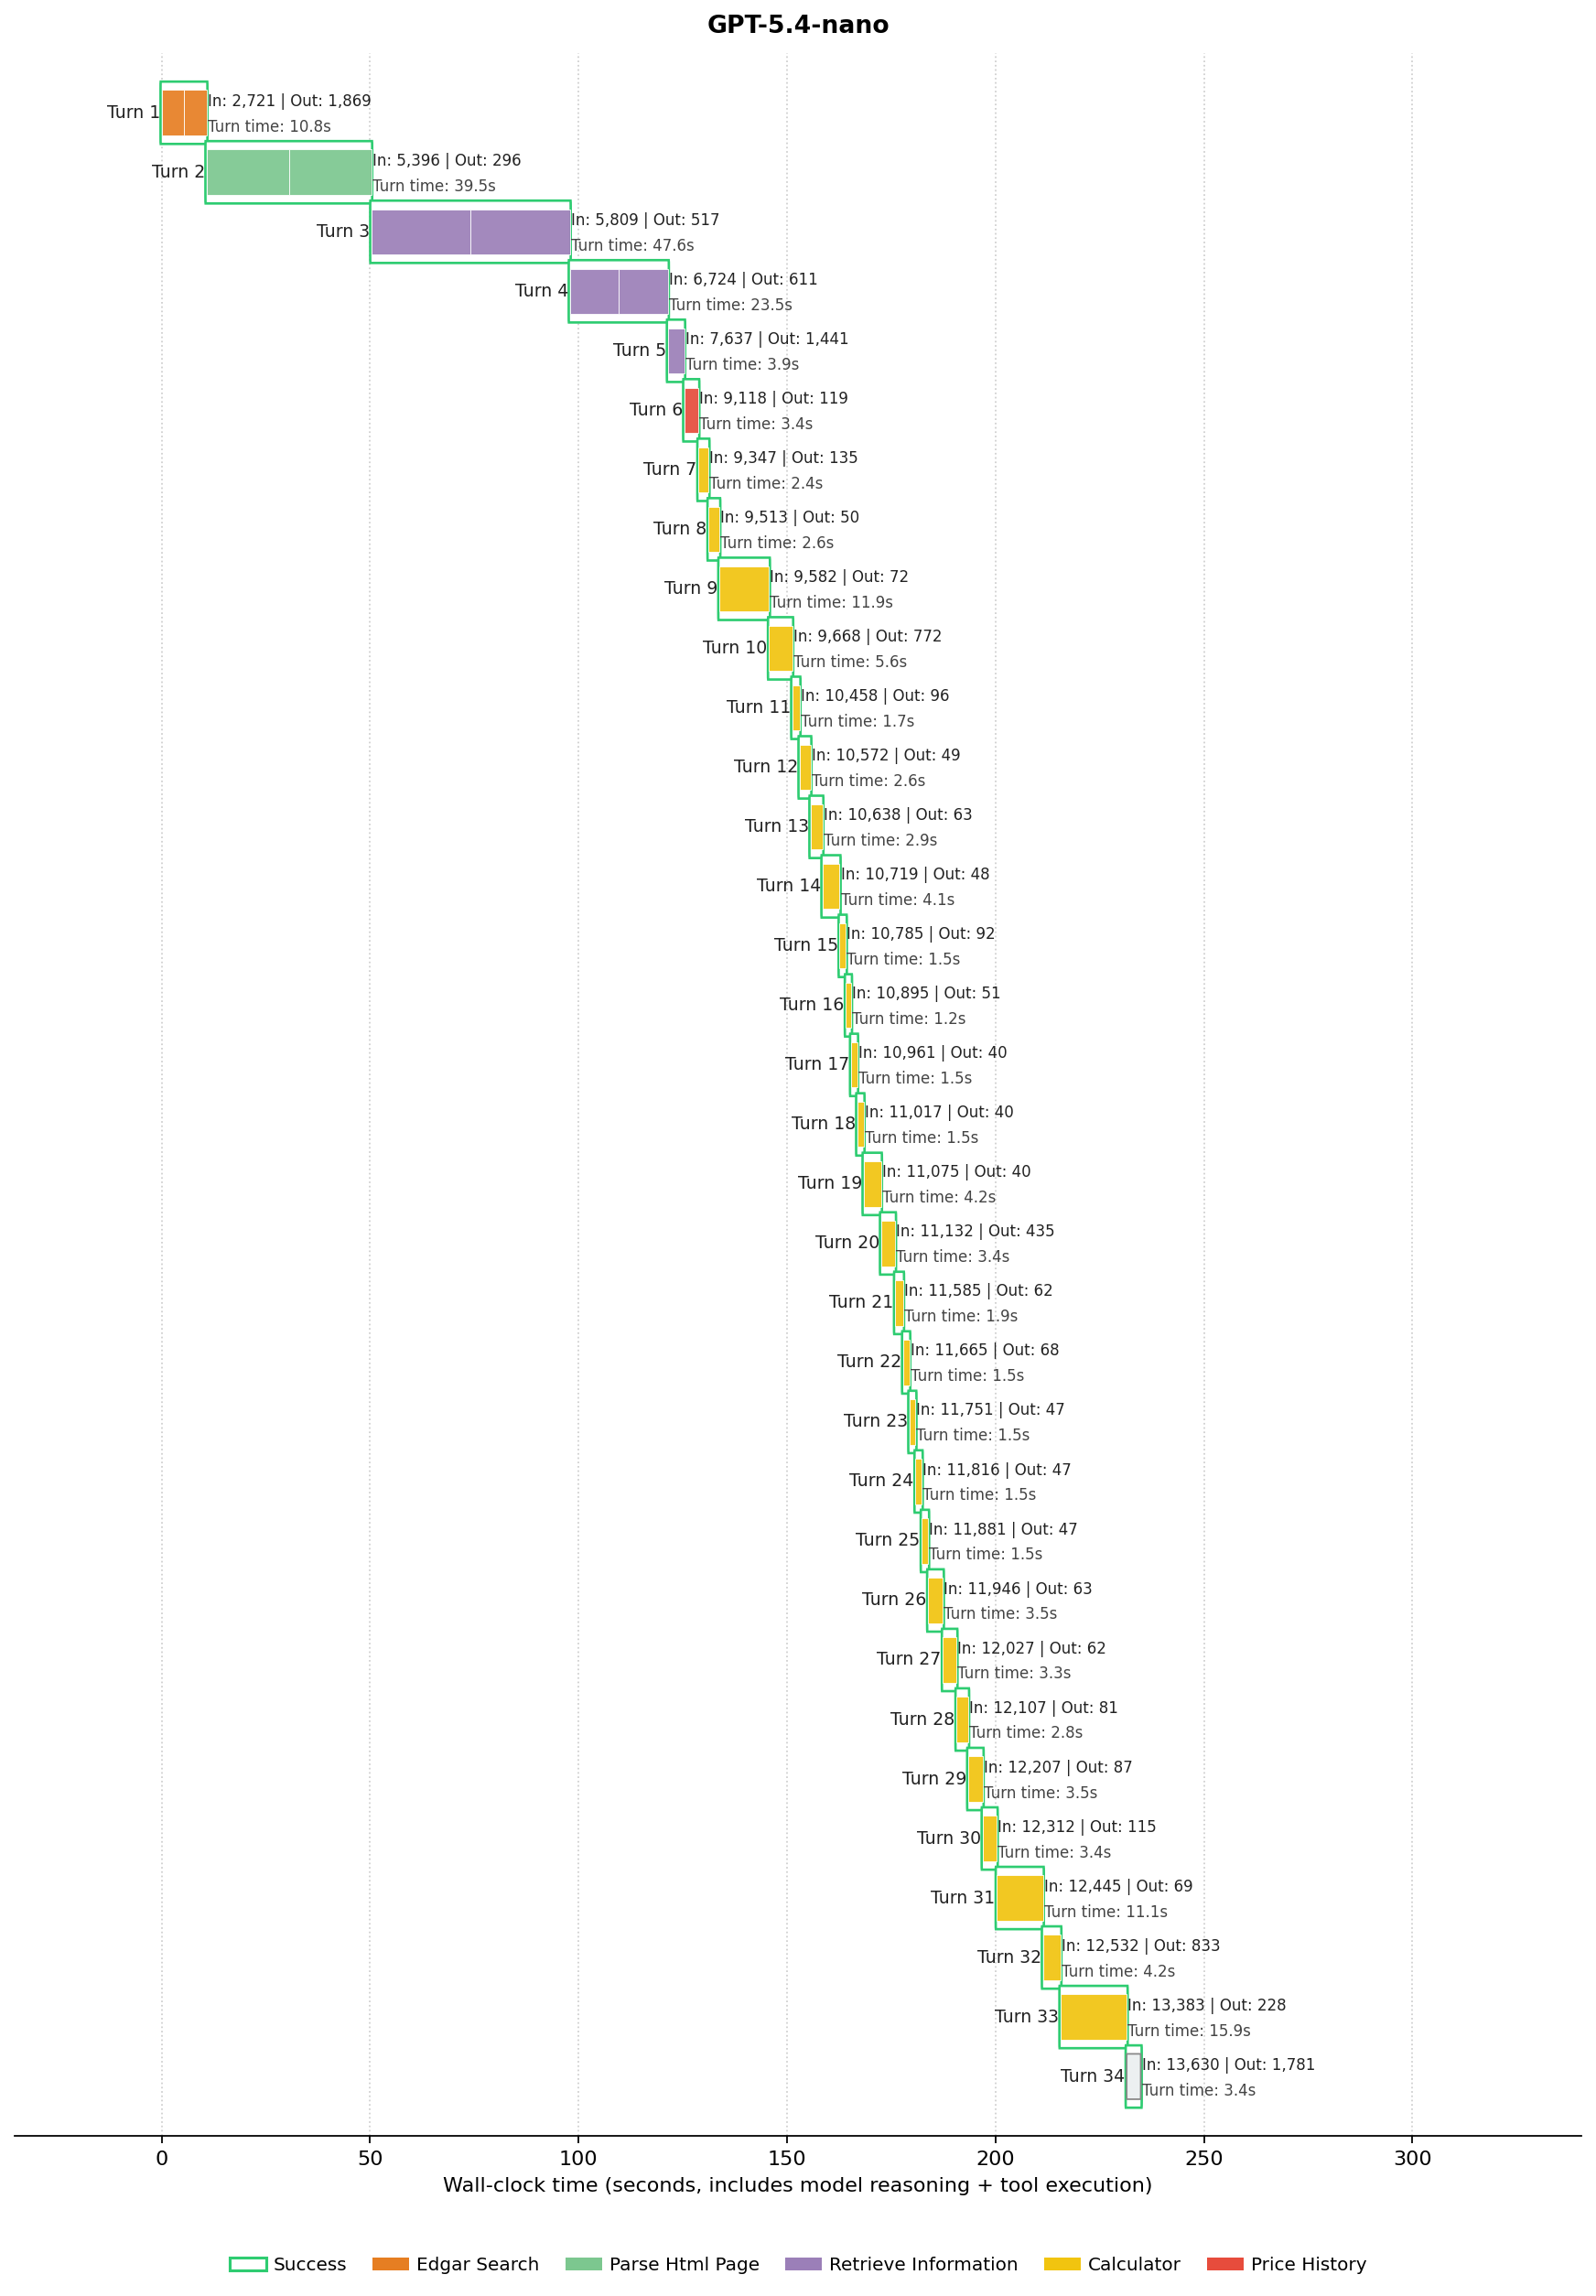
The smaller model needed 34 turns to reach an answer of similar shape — nearly 3x as many. After the retrieval phase, it hammers the calculator one operation at a time for the next 27 turns rather than fanning out parallel calls, and the resulting numbers land close to the rubric’s targets but not exactly enough to be rewarded.
Methodology
Agents are all evaluated on a shared default harness with access to six tools: edgar_search (SEC EDGAR API), web_search, parse_html_page (download an HTML page), retrieve_information (query over fetched HTML), calculator, and price_history.
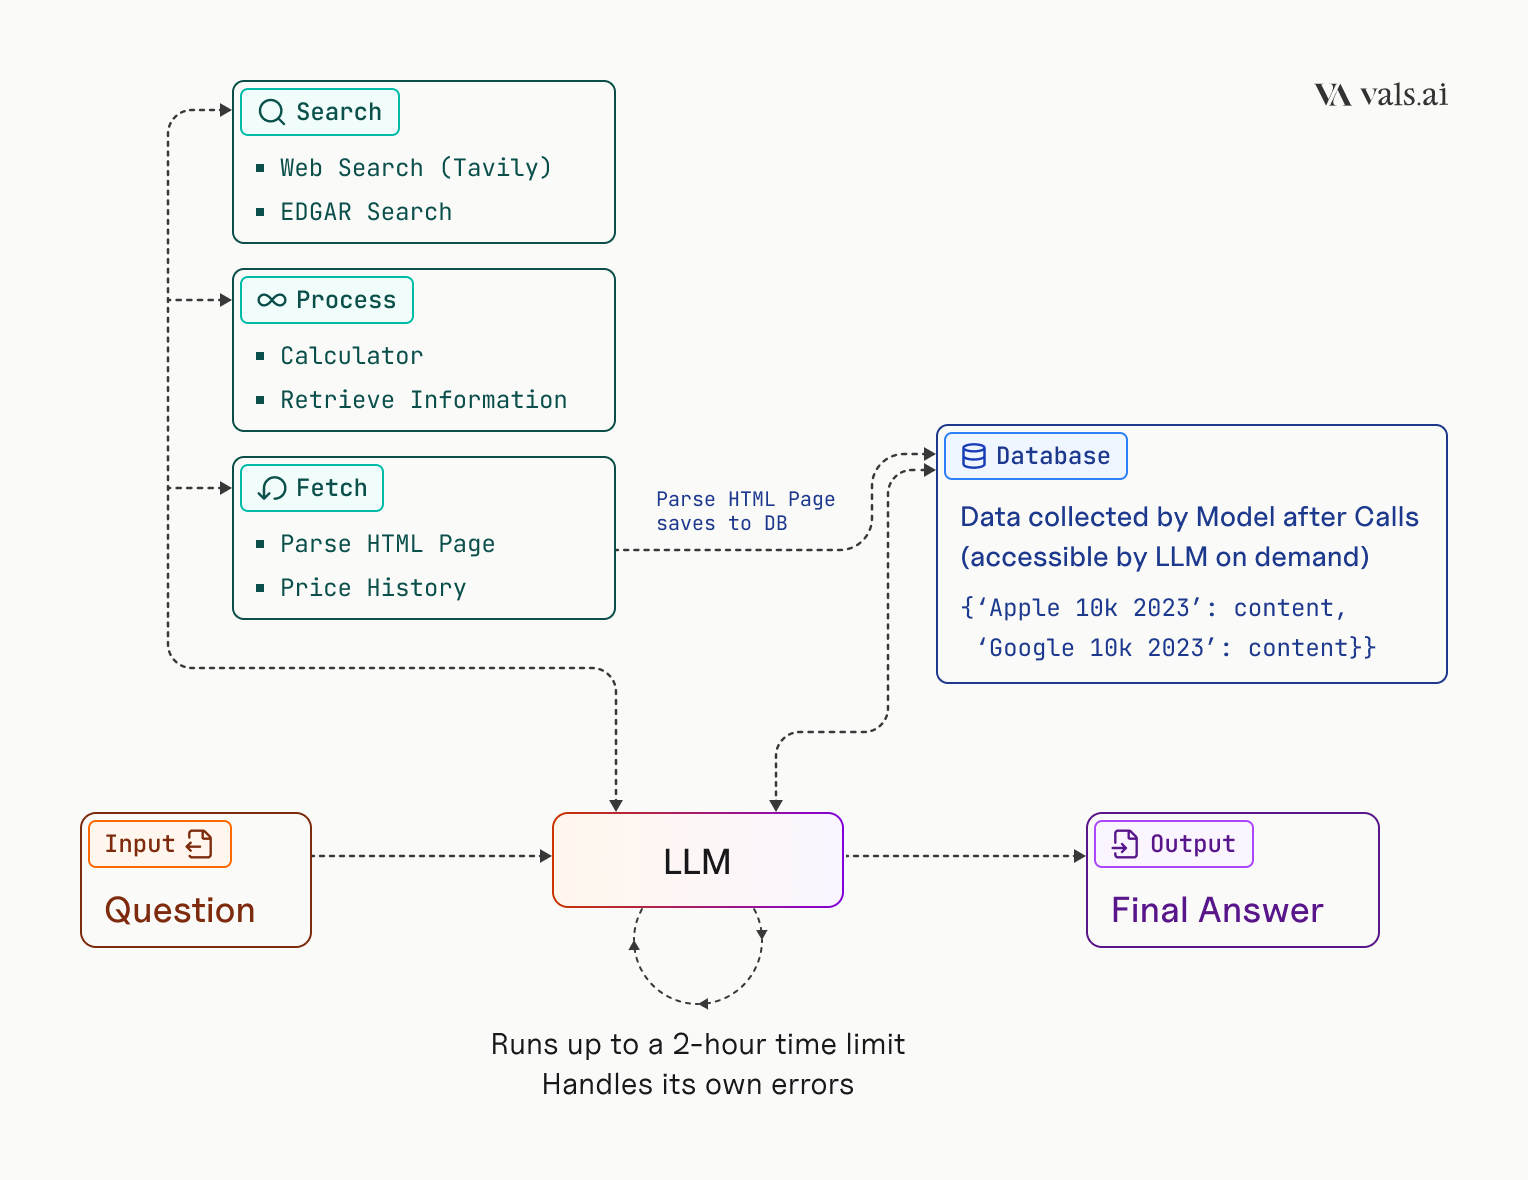
Time Limit
Each task has a two-hour time limit. An answer must be produced within the time limit, otherwise the task is scored as a zero. The time limit was chosen empirically by measuring how long current frontier models need to converge on these tasks and setting the limit comfortably above that ceiling. A fixed time budget also allows us to normalize and compare performance across different agent implementations.
Grading
Each question is composed of weighted checks, and a subset are flagged as dealbreakers, load-bearing facts or numbers, that are required for a satisfactory answer. Failing any dealbreaker means the answer receives no credit for that question, regardless of the remaining content in the response. Two metrics are reported:
- Partial Credit (primary): the dealbreaker-gated, severity-weighted average of per-check scores. A response with a correct dealbreaker but a few peripheral misses scores below 100%; a response with any failed dealbreaker scores 0%.
- All-Pass (secondary): 100% only if every check passes, 0% otherwise.
All responses are graded by a three-judge LLM jury consisting of three frontier models: GPT-5.4, Gemini-3.1-Pro, and Claude Sonnet 4.6.
Changes from v1.1
- Step up in difficulty. Even the best model clears only 52% with Partial Credit and under 40% under All-Pass grading. Questions require connecting data across multiple documents, tighter numeric precision, and answers are expected to include insights that skilled analysts would include but are not explicitly stated in the question.
- Expanded taxonomy. The taxonomy was reorganized around real analyst workflows rather than retrieval tiers. v1.1’s easier retrieval-focused buckets (Quantitative Retrieval, Qualitative Retrieval, Numerical Reasoning, Complex Retrieval, Beat or Miss, Trends) are replaced with Comparables, Precedents, Earnings Analysis, Disclosure Analysis, and a split between General Qualitative and General Quantitative analysis.
- New grading mechanism. Dealbreaker-gated Partial Credit replaces v1.1’s flat per-question score, and All-Pass is reported alongside it as a strict secondary metric.
- Stricter numeric tolerances. Tighter thresholds on rounding and precision drift. Answers that previously passed under v1.1’s looser tolerance now fail.
- Expanded harness. Adds
calculatorandprice_historyon top of the v1.1 tools. - Multi-run aggregation. Every model is run three times; reported scores are mean-of-runs with standard error of the mean.
- Expanded test set. Larger held-out test split for tighter measurement.
Question Design
Questions target the analytical depth expected of a 2nd or 3rd-year investment banking analyst. Each question was designed to satisfy four criteria:
- Determinism. A single, unambiguous correct answer with no room for competing interpretations.
- Multi-source synthesis. Answers require chaining information across multiple filings or data sources rather than a single lookup.
- Domain specificity. Questions require implicit industry knowledge that follows sector convention rather than explicit instruction.
- Forensic precision. Critical information is frequently buried in footnotes, MD&A caveats, or accounting policy disclosures.
Dataset
The dataset is divided into three parts: Public (27 open-source samples), Private Validation (450 samples available for license), and Test (450 samples).
- The Public set and agent harness are fully open and can be accessed here.
- The Private Validation set is available for license. Interested parties are encouraged to contact us directly for access.
- The Test set will remain private. All results reported on this page are based solely on the Test set to prevent overfitting.
The dataset splits were sampled to preserve the distribution of question categories and difficulty.
Question Taxonomy
Finance Agent v2 organizes questions into nine analytical categories reflecting real equity-research workflows.
General Qualitative Analysis
Summarization and comparison of fundamental filing sections: business model, risk factors, MD&A, and standard disclosures across companies.
Compare Walmart, Costco, and Target’s capital allocation priorities across capex, dividends, share repurchases, and debt management.
General Quantitative Analysis
Extraction and calculation of reported financials such as revenue growth, CAGR, leverage ratios, and executive compensation — often requiring verification against restated historicals.
Compare Home Depot and Lowe’s FY2024 inventory efficiency and calculate the difference in days inventory outstanding.
Market Analysis
Relative trading performance, total shareholder return, and how news cycles or guidance shifts drive stock volatility relative to sector indices.
Measure Sun Communities’ stock reaction after the announced sale of Safe Harbor Marinas, then relate the move to the company’s stated use of proceeds.
Comparables
Building trading comps tables, calculating EV multiples, and normalizing enterprise value across peers by adjusting for off-balance-sheet items buried in footnotes.
Rank major U.S. banks by excess CET1 ratio relative to their regulatory minimums.
Precedents
Analyzing M&A transaction multiples from S-4 filings and target financials, with industry-specific EBITDA normalization (e.g. exploration expense add-backs in Oil & Gas).
Extract enterprise values and EV/EBITDA multiples for recent industrial distribution acquisitions and rank the transactions by pre-synergy multiple.
Adjustments
Bridging GAAP to non-GAAP or pro forma figures by reconciling SBC, acquired intangible amortization, and other non-cash items across the P&L and cash flow statement.
Reconcile Honeywell’s GAAP operating income to segment profit across annual releases and identify newly introduced adjustment categories.
Earnings Analysis
Comparing reported results against consensus estimates and prior guidance, including non-GAAP reconciliations across consecutive quarterly reporting cycles.
Compare Rapid7’s Q3 2025 actuals against prior revenue, non-GAAP operating income, and ARR guidance.
Disclosure Analysis
Tracking shifts in MD&A language, KPI definitions, and segment reporting methodology across multiple annual filings, then restating prior periods to reflect the new format.
Track Boeing’s segment reporting and 787 cost-recovery disclosures across FY2022-FY2024 10-K filings.
Financial Modeling
Multi-step frameworks including DCF/NPV, LBO, and M&A accretion/dilution models built from historical ratios extracted from primary filings.
Assess whether Ralph Lauren could justify a distressed acquisition of Capri under stated synergy, margin, and valuation assumptions.
Acknowledgements
We would like to thank Andrew Schettino and all of the financial experts who worked on Finance Agent v2.
Citation
If you use this benchmark in your research, please cite the paper.
Citation (BibTeX)
@misc{bigeard2025fab,
title        = {Finance Agent Benchmark: Benchmarking LLMs on Real-world Financial Research Tasks},
author       = {Bigeard, Antoine and Nashold, Langston and Krishnan, Rayan and Wu, Shirley},
year         = {2025},
month        = may,
howpublished = {Vals AI},
url          = {https://arxiv.org/abs/2508.00828},
}