
Key Takeaways
- The foundation models are currently ill-suited to perform open-ended questions expected of entry-level finance analysts
- A majority of models struggled with tool use in general, and more specifically for information retrieval, leading to inaccurate answers — most notably the small models like Llama 4 Scout or Mistral Small 3.1.
- Models on average performed best in the simple quantitative (37.57% average accuracy) and qualitative retrieval (30.79% average accuracy) tasks. These tasks are easy but time-intensive for finance analysts.
- On our hardest tasks, the models perform much worse. Ten models scored 0% on the Trends task, and the best performance on this task was only 28.6% by Claude Sonnet 3.7.
- o3 is the best performing model reaching 48.3%, but at the cost of an average of $3.69 per question. It is followed closely by Claude Sonnet 3.7 Thinking which got 44.1% accuracy, at the much lower price per question of $1.05.
Background
The frontier of applied AI is agents – systems that independently direct their own processes to maintain control over how they accomplish tasks on behalf of users [1] [2]. As such, foundation model labs have invested heavily in developing agents that can handle complex tasks [3], making them prime candidates for delivering significant ROI in specialized industries [1] [4].
Finance is one of the most lucrative applications of agents [5], where AI has the potential to drive significant efficiency gains by performing tasks that mirror those of an entry-level financial analyst [6]. Yet, there lacks a framework for evaluating these agents [7], highlighting the need for standardized evaluation methods to measure agentic ability domain-specific tasks.
We have created a benchmark that tests the ability of agents’ to perform tasks expected of an entry-level financial analyst. In collaboration with Stanford researchers, a Globally-Systemic Important Bank, and industry experts, we created a dataset of 537 questions that evaluate skills such as simple retrieval, market research, and projections.
We find that none of the existing AI models exceed 50% accuracy, indicating that models still have a long way to go before they can be deployed reliably and trusted in the finance industry.
Results
/
The Pareto cost-curve above illustrates the relationship between model accuracy and cost per session across different models. o3 leads with 48.3% accuracy at approximately $3.69 per session. Claude 3.7 Sonnet achieves 42.9% accuracy at $0.99 per session, representing a strong performance-to-cost ratio.
The remaining models cluster in the lower left quadrant, with most accuracies below 30% and costs under $0.50 per session, demonstrating a clear trade-off between performance and computational expense. This distribution suggests that higher-performing models currently require substantially more resources to achieve their superior results.
As model performance improves, these cost considerations will likely be more important. Some challenging queries cost more than 5 dollars for o1 or o3 to produce their response. Scaling the cost by relying on more API requests of a high-performing model may continue to drive up the price, presenting practical limitations to their usage. o1 is particularly expensive for its performance.
The tool call analysis reveals how many steps the models take to produce an answer. Interestingly, o3 and Claude 3.7 Sonnet (Thinking), the two best performers on this benchmark, also register the highest number of tool calls. This suggests that their comparatively strong performance on financial analyst tasks is partly due to leveraging the tools provided.
In contrast, Llama 4 Maverick, one of the lowest performing models, takes one of the lowest number of turns to produce an answer, averaging at 6.3 turns. That is most likely caused by a misunderstanding of the tools, and a tendency to give the answer before trying out more.
GPT-4o Mini is an interesting exception. It is the model that makes the most tool calls by far (at least twice as many as most models), but it still performs poorly. It often misuses the tools by providing arguments in the wrong format or not calling the tools in the expected order which leads to more errors, which in turn requires it to retry more tool calls.
The spider graph detailing the number of tool calls performed by each model further supports the notion that the number of tool calls generally leads to higher accuracy. Again, we see Claude 3.7 Sonnet and Claude 3.7 Sonnet (Thinking) excelling by making the most tool calls, especially for retrieving information, parse html_page, and Google web-search, which leads to top benchmark performance.
Model Output Examples
Q
What is the Total Number of Common Stock Shares Repurchased by Netflix (NASDAQ: NFLX) in Q4 2024?
A
Based on Netflix's 10-K filing with the SEC for the fiscal year ended December 31, 2024, the total number of common stock shares repurchased by Netflix (NASDAQ: NFLX) in Q4 2024 was 1,165,827 shares. This Q4 2024 repurchase is broken down by month as follows: October 2024: 519,883 shares, November 2024: 457,732 shares, December 2024: 188,212 shares. It's worth noting that many news sources reference Netflix repurchasing 9.9 million shares for $6.2 billion, but this refers to the company's total share repurchases for the entire fiscal year 2024, not just the fourth quarter.
{ "sources": [ { "url": "https://www.sec.gov/Archives/edgar/data/1065280/000106528025000044/nflx-20241231.htm", "name": "Netflix Inc. (NFLX) 10-K for Fiscal Year Ended December 31, 2024" }, { "url": "https://cdn.arstechnica.net/wp-content/uploads/2025/01/FINAL-Q4-24-Shareholder-Letter.pdf", "name": "Netflix Q4 2024 Shareholder Letter" }, { "url": "https://www.ainvest.com/news/netflix-stock-surges-on-strong-earnings-15b-buyback-250110104726f6dd8e12f968/", "name": "AInvest: Netflix Stock Surges on Strong Earnings" } ] }
CORRECT
The right answer we were looking for was “1,165,827 Shares repurchased by Netflix in Q4 2024”. To answer this question, the finance expert did the following: go to EDGAR, search Netflix Filings by ticker, identify the 10-K for 2024, search for Company Purchases of Equity Securities, calculate the Total Number of Shares Purchased from Oct 1, 2024 - Dec 31, 2024.
GPT-4o did not retrieve the document and did not re-try to find the correct one. As a result it did not find an answer to the question. Llama 3.3 retrieved some links from a Google search that lead it to produce an incorrect answer.
In contrast, both Gemini 2.5 Pro and Sonnet 3.7 Thinking found the same 10K document as the expert and produced an accurate response. Sonnet 3.7 Thinking made 14 tool calls, took 120 seconds, 261,491 input tokens and 4,012 output tokens, costing 84 cents. Gemini 2.5 Pro made 7 tool calls, took 108 seconds, 146,759 input tokens and 11,003 output tokens, costing 33 cents.
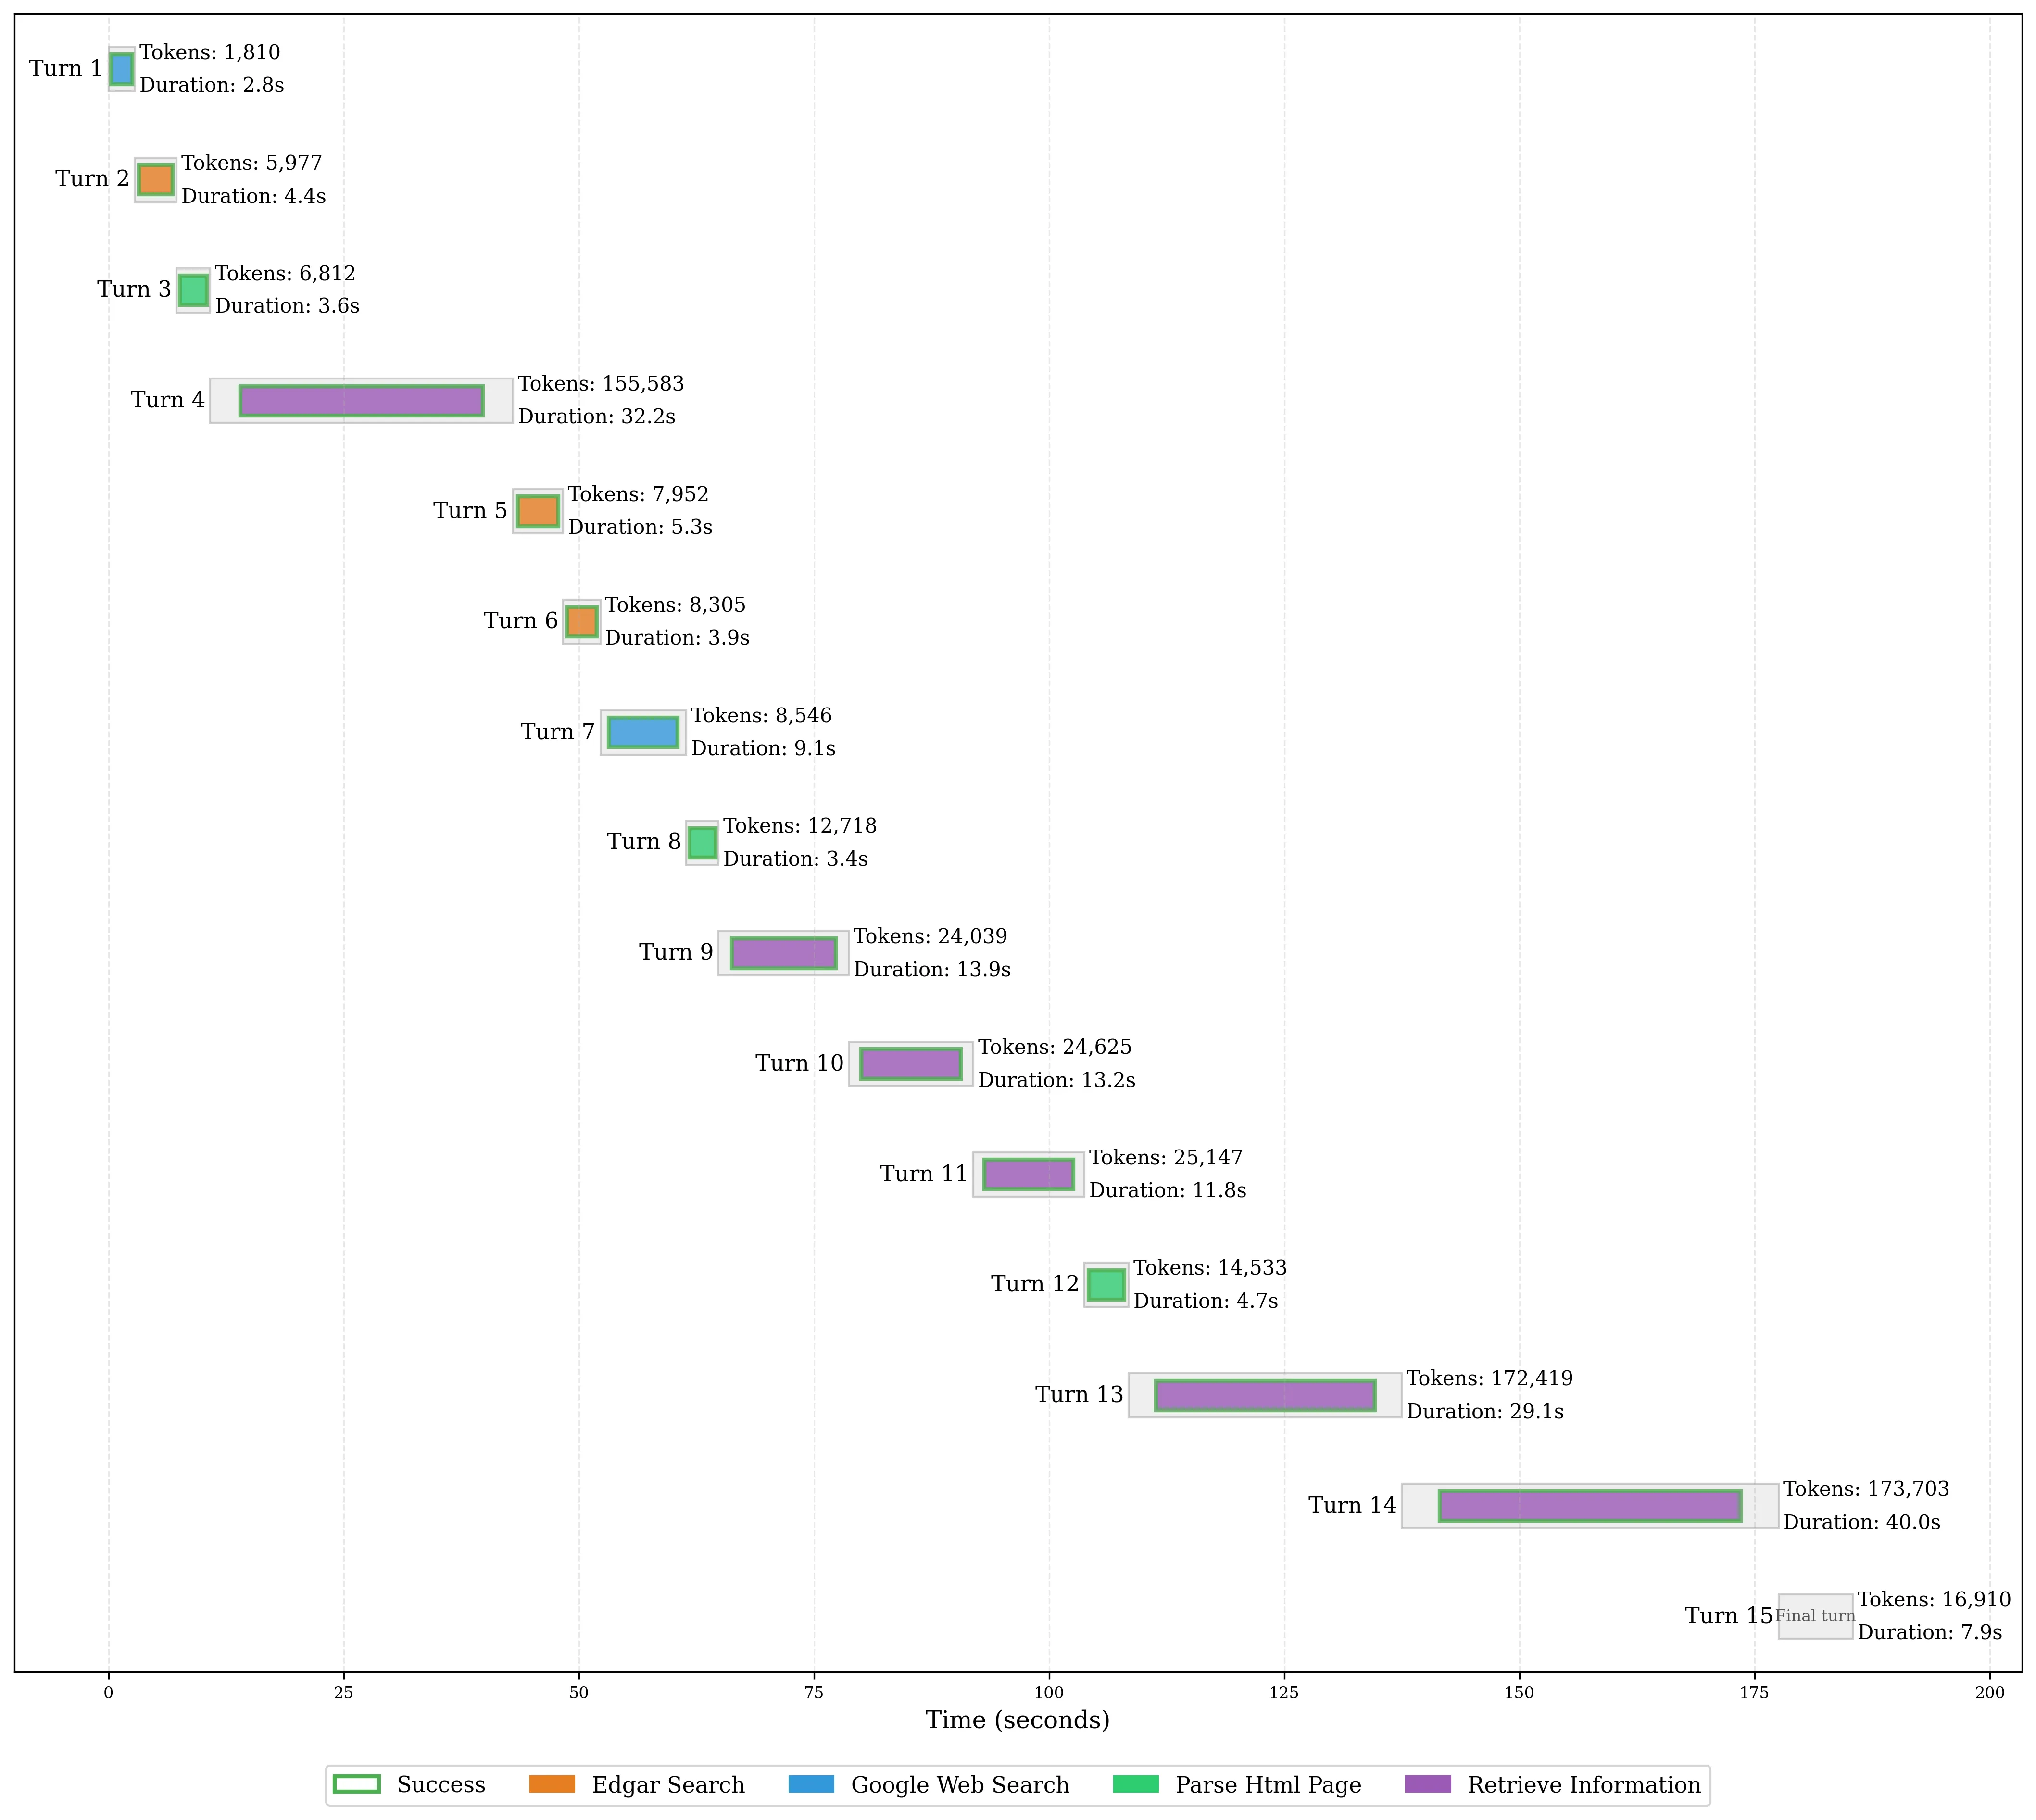
Trajectory Comparison
The visualizations below illustrate the sequence and types of tool calls made by different models. Each node represents a step in the model’s reasoning process, with colored nodes indicating specific tool calls. These trajectories reveal how models approach research tasks, with more thorough tool usage often correlating with better performance.
Question:
Due to its business combinations, what is RTX Corp's (NYSE: RTX) projected future contractual obligation consumption for 2025 - 2029. Provide the amount for each year.
Sonnet 3.7 Answer:
Based on RTX Corp's 2025 10-K filing, the company's projected future contractual obligation consumption related to business combinations for the years 2025-2029 is as follows:

- 2025: $71 million
- 2026: $82 million
- 2027: $85 million
- 2028: $83 million
- 2029: $70 million
- Thereafter: $263 million

These figures represent the expected consumption of contractual obligations that were recorded in connection with RTX's past acquisitions, specifically Rockwell Collins (2018), Goodrich (2012), and Raytheon Company (2020). The total balance of these contractual obligations was $654 million as of December 31, 2024.

It's worth noting that RTX has not engaged in any significant acquisitions in 2022, 2023, or 2024, and has instead been divesting certain businesses. Therefore, these contractual obligations stem from previous business combinations rather than recent acquisitions.
Sonnet 3.7 Trajectory:
o1 Answer:
Based on RTX’s most recent available 10-K, the company does not publish a single, comprehensive contractual-obligations figure by year for 2025–2029. Instead, it breaks out certain categories individually. Below are the amounts disclosed (units in billions unless otherwise noted). For categories without annual detail, only partial or summarized totals appear in the filing:

• 2025:
  – Long-Term Debt Principal: US$2.34
  – Operating Leases: US$0.434 (millions converted to billions)
  – Commercial Aerospace Commitments (Net of Collaboration Partners’ Share): US$1.48
  – Purchase Obligations: US$25.5 (no annual detail beyond 2025)

  ► Combining the three categories that have annual detail (debt, leases, aerospace): ≈ US$4.254.
  ► Adding the known US$25.5 for purchase obligations provides ≈ US$29.754 in total for these items.

• 2026:
  – Long-Term Debt Principal: US$4.51
  – Operating Leases: US$0.385 (millions converted to billions)
  – Commercial Aerospace Commitments: US$1.38
  – Purchase Obligations: Not broken out

  ► Known categories total ≈ US$6.275.

• 2027:
  – Long-Term Debt Principal: US$2.94
  – Operating Leases: US$0.326 (billions)
  – Commercial Aerospace Commitments: US$0.89
  – Purchase Obligations: Not broken out

  ► Known categories total ≈ US$4.156.

• 2028:
  – Long-Term Debt Principal: US$3.48
  – Operating Leases: US$0.270
  – Commercial Aerospace Commitments: US$0.49
  – Purchase Obligations: Not broken out

  ► Known categories total ≈ US$4.24.

• 2029:
  – Long-Term Debt Principal: US$0.92
  – Operating Leases: US$0.193
  – Commercial Aerospace Commitments: US$0.40
  – Purchase Obligations: Not broken out

  ► Known categories total ≈ US$1.513.

Because purchase obligations (beyond 2025) and certain other items (e.g., interest, pension, taxes) are not itemized by year in this period, the total annual contractual obligation amounts for 2026–2029 cannot be fully calculated from the 10-K’s disclosures.
o1 Trajectory:
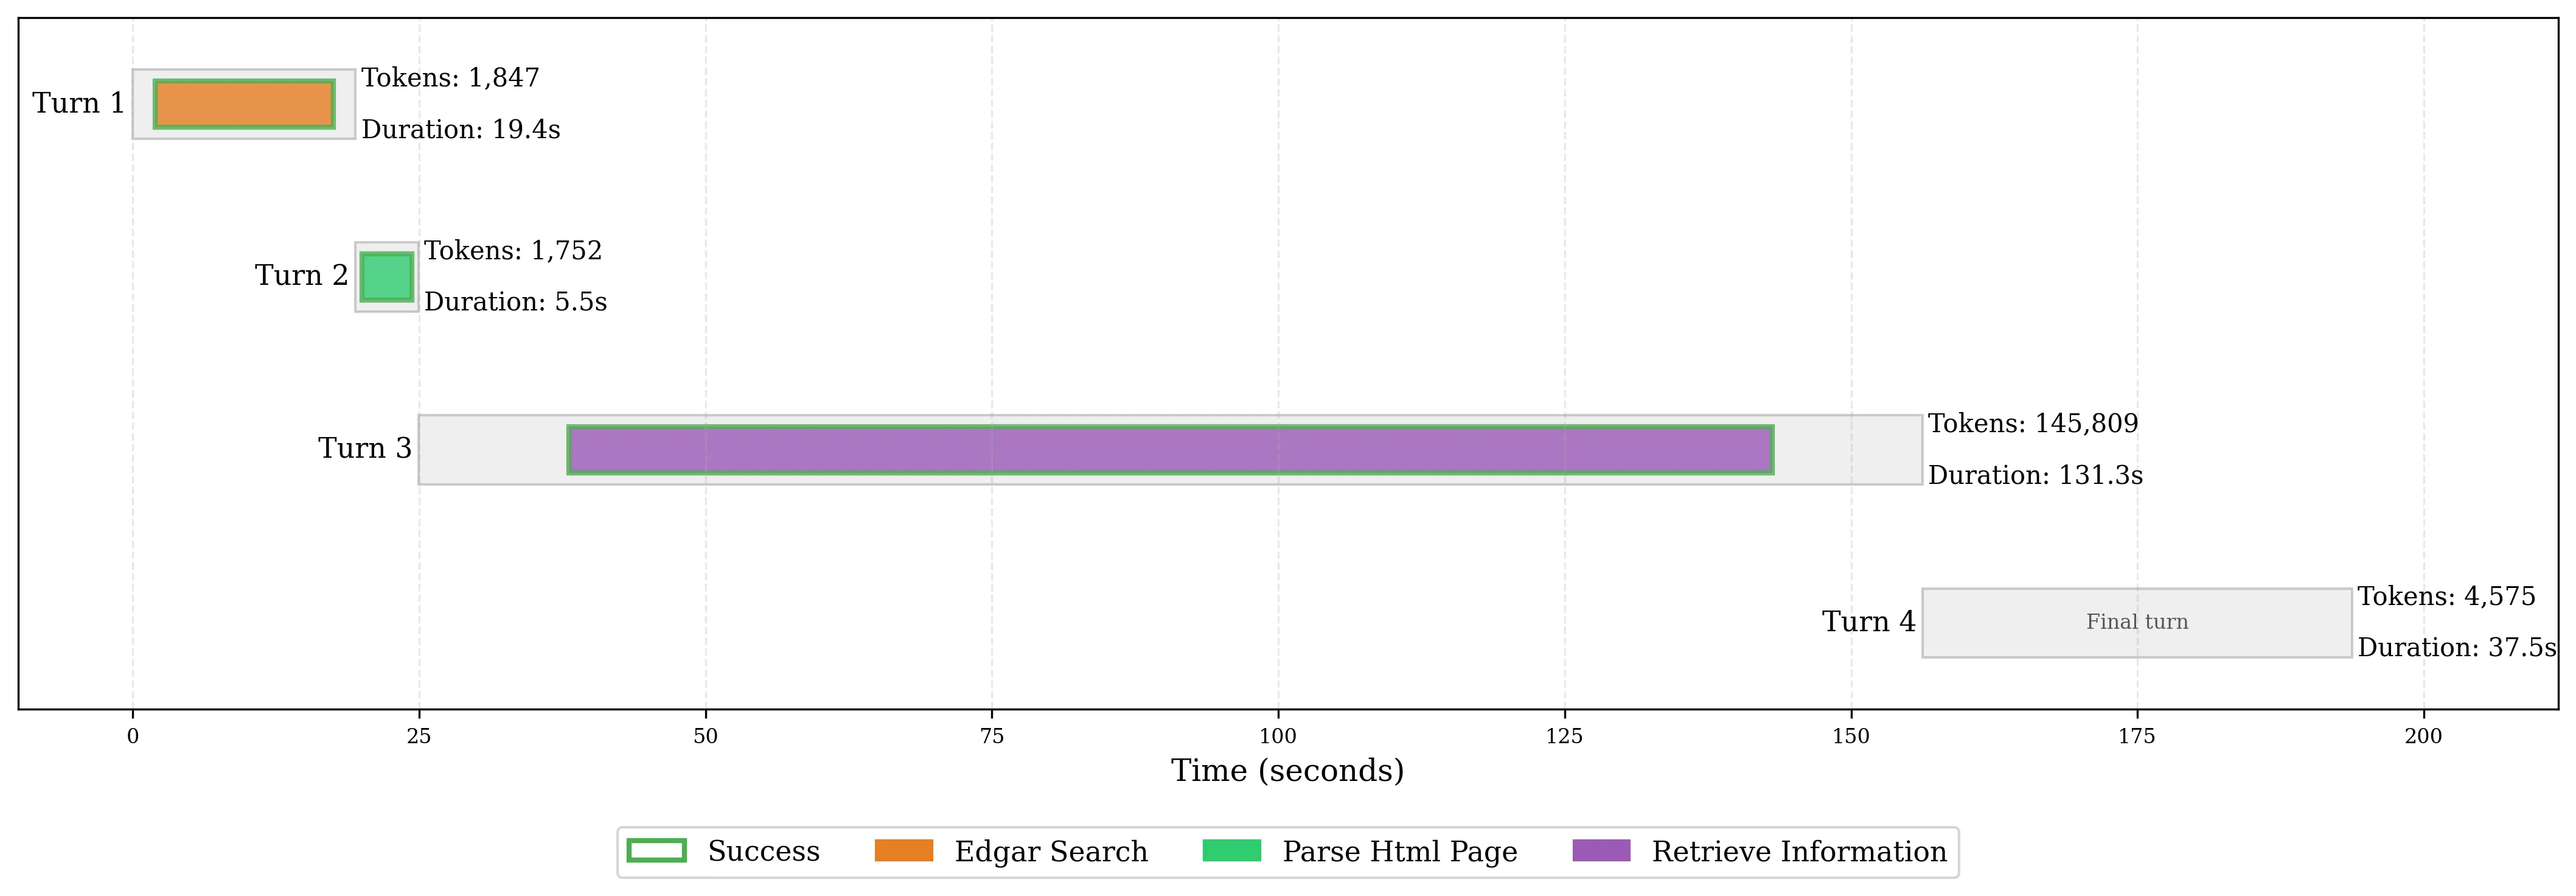
In this case, when the first set of retrieved documents did not contain the correct information, o1 did not try to retrieve additional items. In general, we noticed o1 was much less likely to retry tools if they did not have errors
Methodology
The finance industry comprises a wide array of tasks, but through consultation with experts at banks and hedge funds, we identified one core task shared across nearly all financial analyst workflows: performing research on the SEC filings of public companies. This task —while time-consuming— is foundational to activities such as equity research, credit analysis, and investment due diligence. We collaborated with industry experts to define a question taxonomy, write and review 537 benchmark questions.
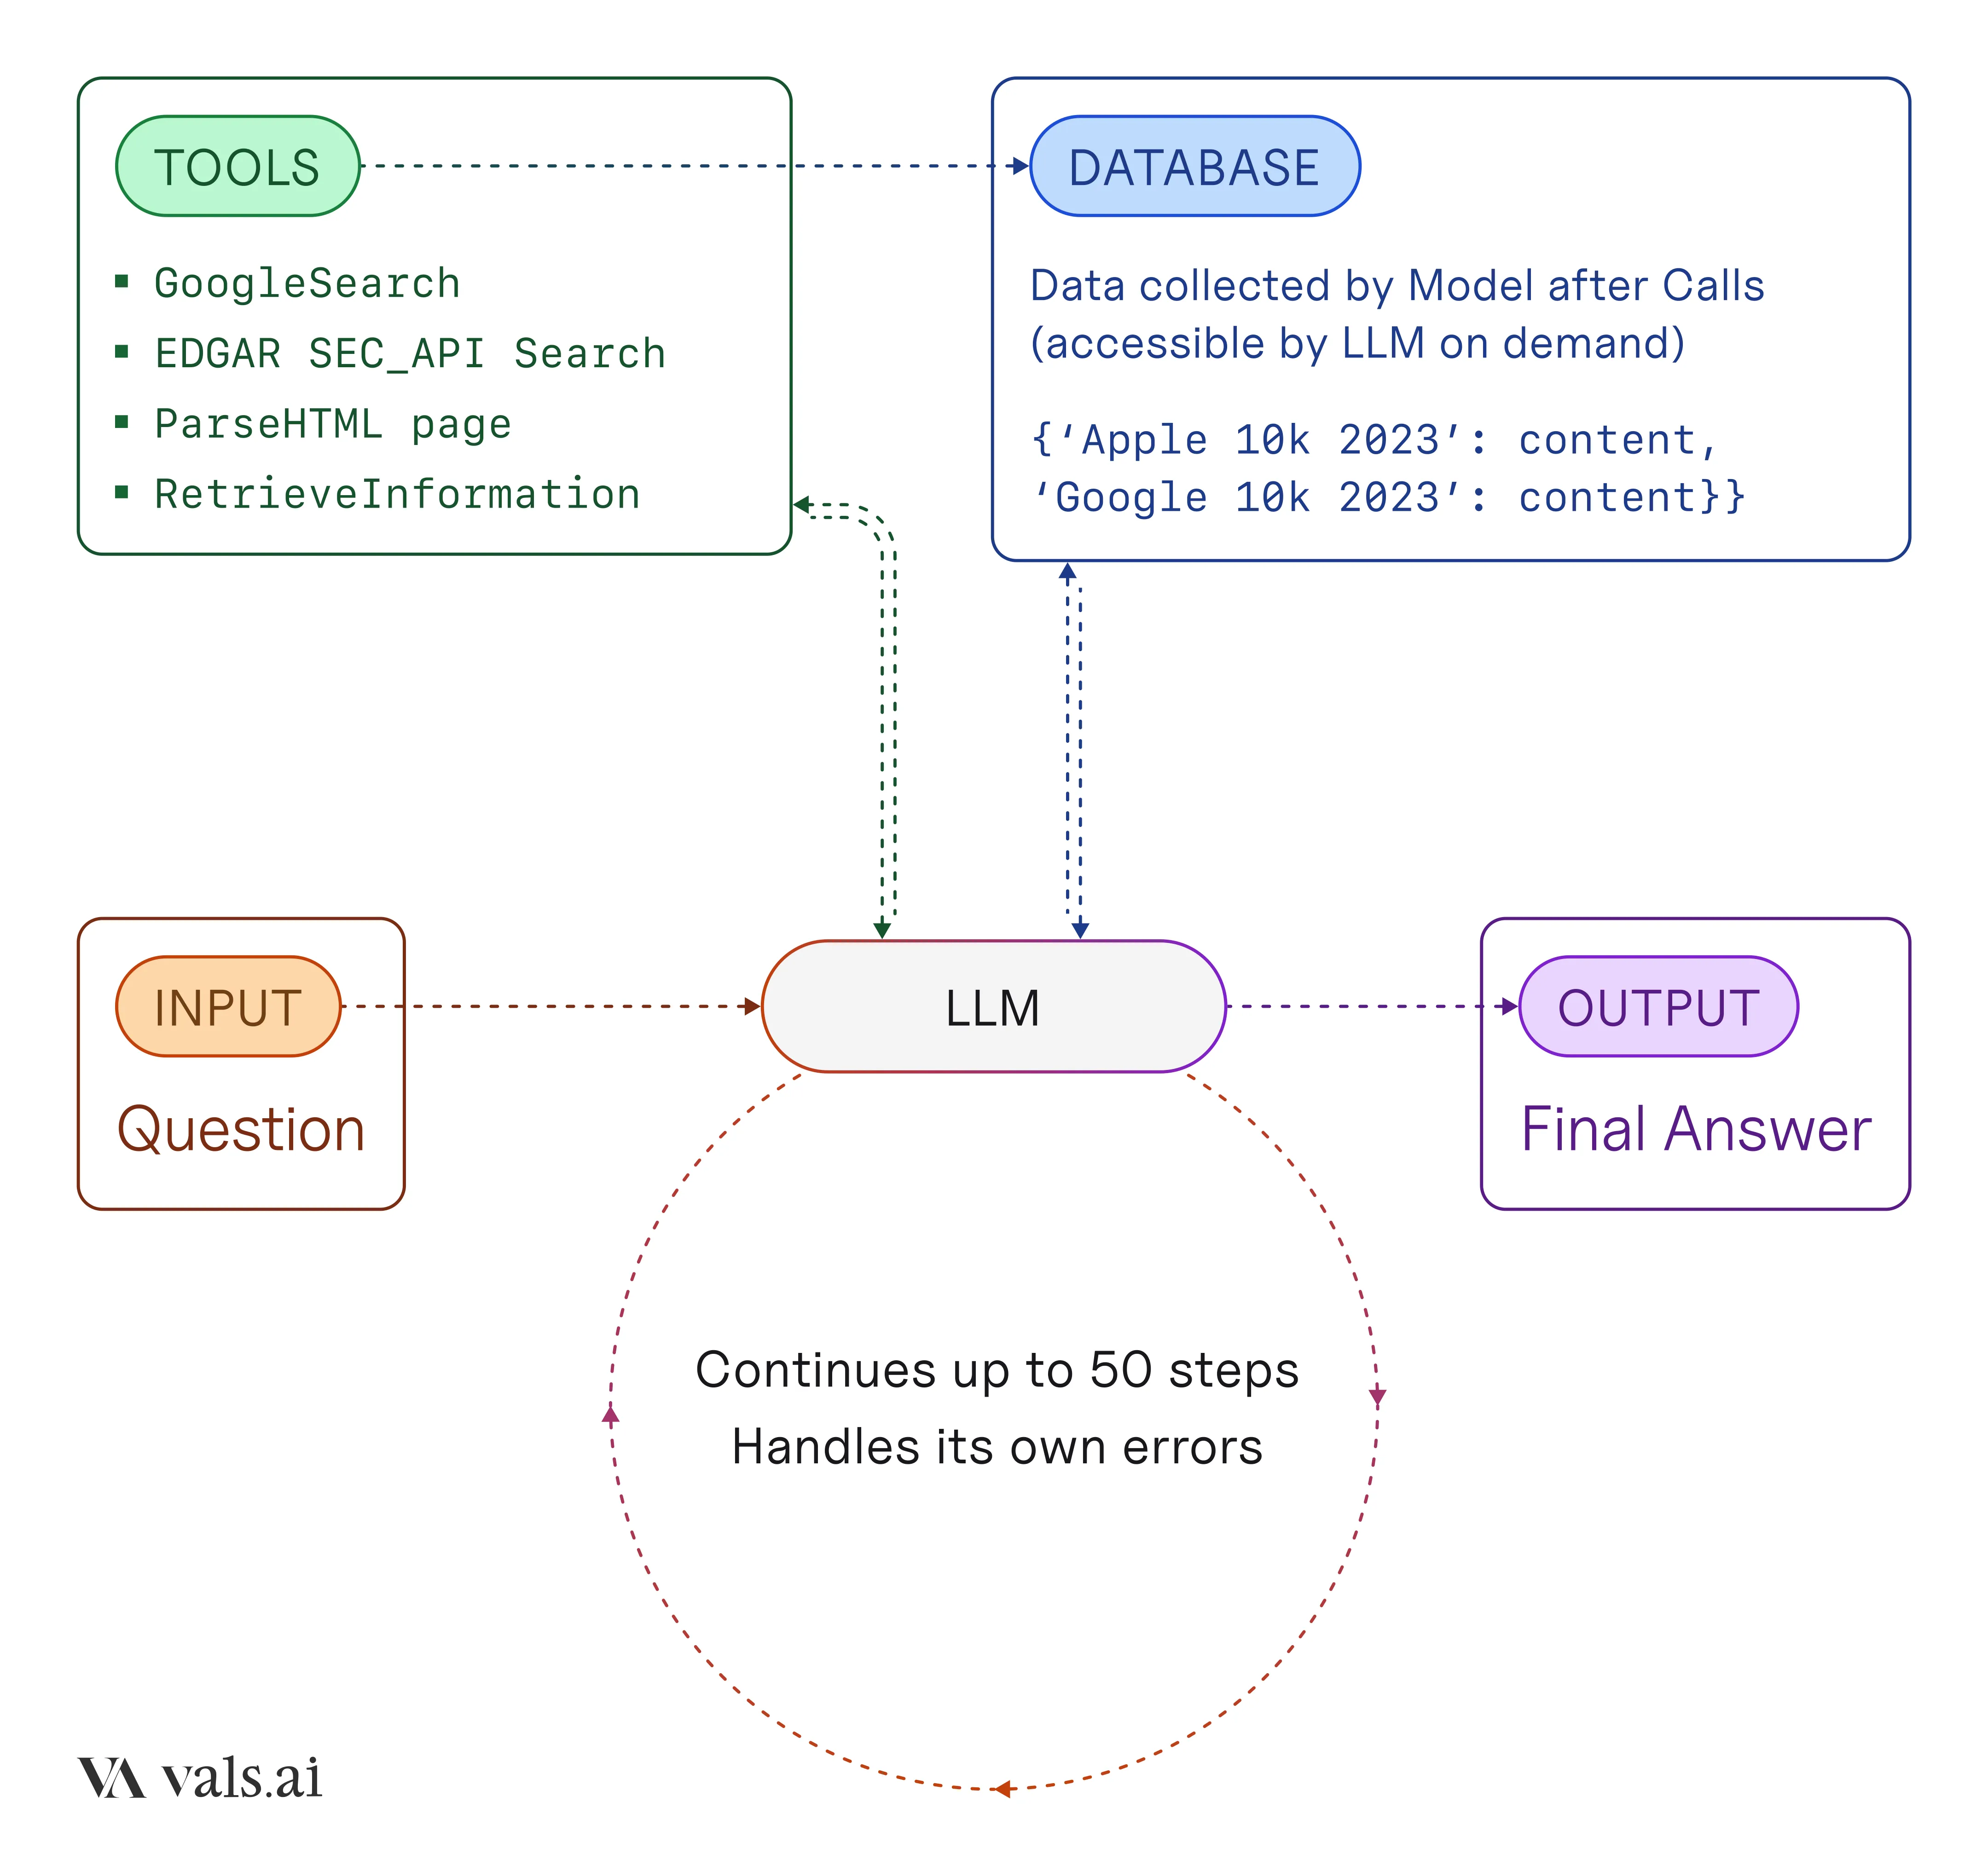
The AI agents were evaluated in an environment where they had access to tools sufficient to produce an accurate response. This included an EDGAR search interface via the SEC_API, Google search, a document parser (ParseHTML) for loading and chunking large filings, and a retrieval tool (RetrieveInformation) that enabled targeted questioning over extracted text. The human experts did not make use of any additional tools when writing and answering their questions. See the full harness here.
Our primary evaluation metric was final answer accuracy (see the GAIA benchmark). We also recorded latency, tool utilization patterns, and associated computational cost to provide a fuller picture of agent efficiency and practical viability. Together, these components form a rigorous and domain-specific evaluation framework for agentic performance in finance, advancing the field’s ability to measure and rely on AI in high-stakes settings.
The code behind this harness is open source. Dive in and explore it yourself on this repo!
Dataset
The dataset is divided into three parts: Public Validation (50 open-source samples), Private Validation (150 samples available for license), and Test (337 samples).
-
The Public Validation set is fully open and can be accessed at here.
-
The Private Validation set is available for license. Interested parties are encouraged to contact us directly for access.
-
The Test set will remain private permanently. All results reported in this page are based solely on the Test set to prevent potential future overfitting.
The dataset splits were sampled to preserve the distribution of question types and performance characteristics. We observed a strong correlation in performance across the validation sets and the Test set, supporting the reliability of these splits.
Question Taxonomy
Quantitative Retrieval (easy)
Direct extraction of numerical information from one or more documents without any post-retrieval calculation or manipulation.
What was the quarterly revenue of Salesforce (NYSE:CRM) for the quarter ended December 31, 2024?
Qualitative Retrieval (easy)
Direct quotation or summarization of non-numerical information from one or more documents.
Describe the product offerings and business model of Microsoft (NASDAQ:MSFT)?
Numerical Reasoning (easy)
Calculations or aggregation of key numbers to produce an answer.
What is % of revenue derived from AWS in each year and the 3 year CAGR from 2021-2024 of Amazon?
Complex Retrieval (medium)
Numerical or non-numerical retrieval or content summarization requiring synthesis of information from multiple documents.
Please briefly summarize the most recent capital raise conducted by Viking Therapeutics (NASDAQ:VKTX).
Adjustments (medium)
Quantitative and qualitative analysis of reporting context bridging GAAP and Non-GAAP Financial Metrics.
What is Lemonade Insurance’s Adjusted EBITDA for the year ended December 31, 2024?
Beat or Miss (medium)
Comparison of forward management guidance versus actuals, synthesized by reconciling sequential quarterly reporting documents.
How did Lam Research’s revenue compare to management projections (at midpoint) on a quarterly basis in 2024? Format as % BEAT or MISS. Use guidance provided on a quarterly basis.
Trends (hard)
Analyze patterns within a single company’s reporting structure or calculate and contextualize evolving performance, key metrics or business composition.
Which Geographic Region has Airbnb (NASDAQ: ABNB) experienced the most revenue growth from 2022 to 2024?
Financial Modeling (hard)
Complex numerical reasoning calculations which require additional financial expertise to define and evaluate.
How much M&A firepower does Amazon have as of FY2024 end including balance sheet cash, non-restricted cash and other short term investments, and up to 2x GAAP EBITDA leverage? Round to nearest billion
Market Analysis (hard)
Advanced analysis of one or more companies using various documents, requiring normalization of comparison metrics, or complex reasoning and usage of causality to contextualize drivers of business changes or competition dynamics.
Compare the quarterly revenue growth of FAANG companies between 2022-2024.
Acknowledgements
Thanks to the following people for their support: Shirley Wu, Alfston Thomas, Andrew Schettino, Kathy Ye, Kyle Jung, Matthew Friday, Michael Xia, and Nicholas Crawley-Brown.